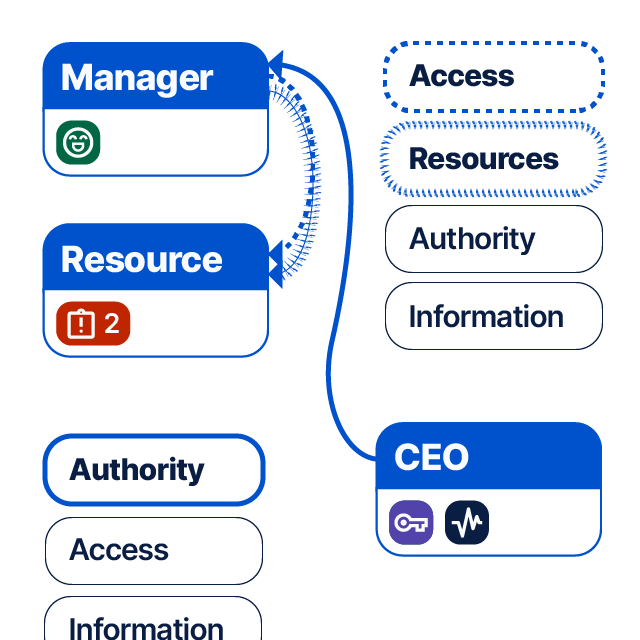
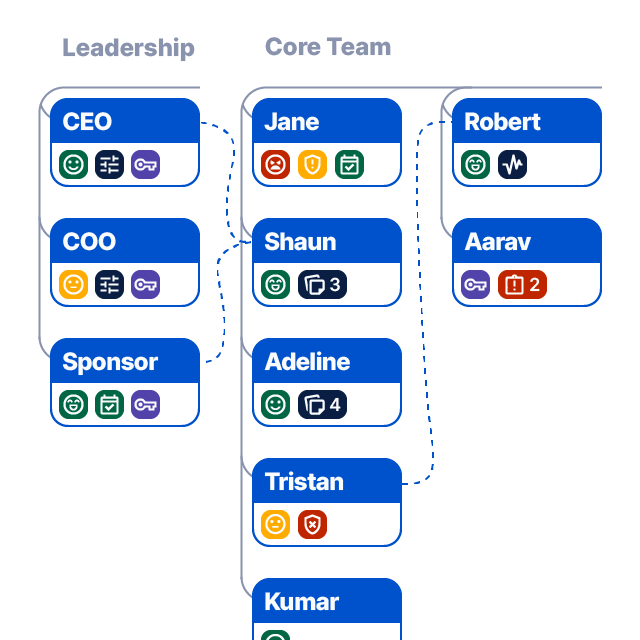
Map stakeholders and relationships visually
See stakeholders, relationships and key dimensions in one shared view.
Description: The pie chart below visualises the distribution of values for the selected dimension, for this map.
Prerequisites: Dimensions: Any of the below.
Description: The network chart below visualizes all flows between stakeholders, for this map.
Prerequisites: Stakeholder flows.
Description: The table below visualizes the suggested management strategy of stakeholders based on their influence and interest, for this map.
Prerequisites: Dimensions: Influence and Interest.
Description: The bubble chart below visualizes the importance weighting of stakeholders based on certain dimensions, for this map.
Prerequisites: Dimensions: Decision closeness, Dependency: Yours on them, Influence, Key stakeholder and Resources: Held.
Description: The table below visualises stakeholders in time windows (relative to your browser's timezone), along with their respective timezones, for this map.
Prerequisite: Dimension: Location.
| Time window | Behind | Ahead |
|---|---|---|
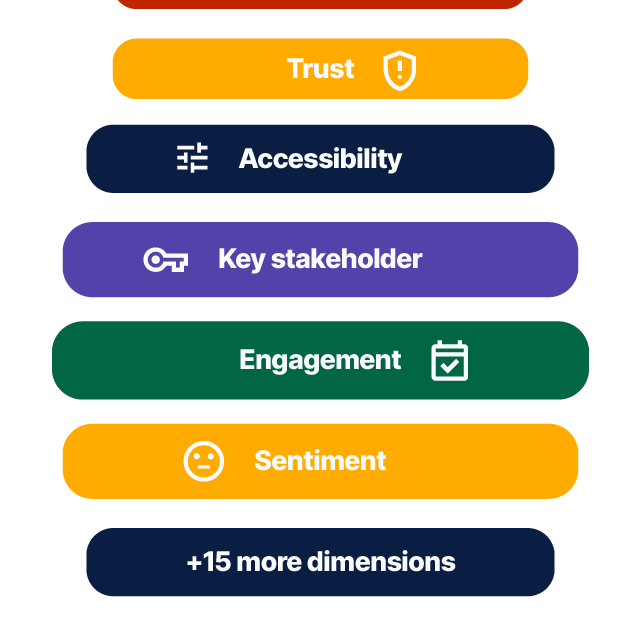
How easy it is for stakeholders to access, understand, and participate in the engagement, given practical, informational, and personal constraints.
A magic link is a secure, one-time link we'll email to you. Click it to sign up or sign in - no password needed.
*Stakeholder Relationship Management
Early access beta: Pricing and some features are still evolving
See stakeholders, relationships and key dimensions in one shared view.
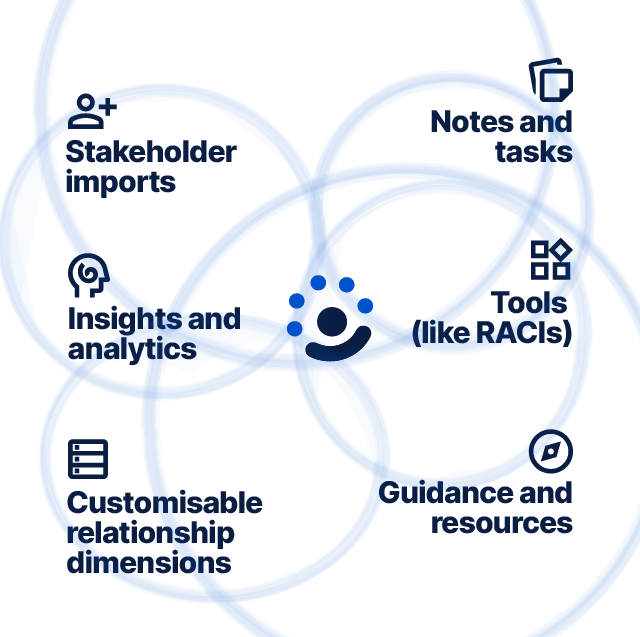
Capture context, conversations and signals directly against stakeholders.
Turn stakeholder dimensions, notes and history into practical guidance and insights.
Identify, map and monitor dependencies, sensitivities and relationships.